
According to the Russian Federal State Statistics Service (Rosstat), annual inflation in December 2024 amounted to 9,5% [ref], and the average for 2024 is 8,4% [ref]. This allows the Russian authorities to claim that in the third year of the war, despite international sanctions, they managed to keep inflation below 10%, which is the boundary between moderate and galloping inflation, and to ensure real (inflation-adjusted) growth of macroeconomic indicators such as GDP and real incomes of the population.
The official Rosstat data on inflation in 2024 raise many questions and doubts among Russian and foreign economists [ref1, ref2, ref3, ref4]. However, no one provides convincing refutations of these data. Therefore, the experts of the Trust but verify project decided to independently verify the correctness of the value of official inflation according to Rosstat using standard methods of data analysis.
.png)
Mark Beygelzimer, PhD, systems analyst, head of the Trust but Verify project.
Briefly
1. More than twofold difference between the official inflation according to Rosstat and alternative ROMIR estimates does not in itself indicate that one of these estimates is incorrect. Such a difference can theoretically be explained by methodological peculiarities, in which case these indicators should be considered simply as different estimates of real inflation.
2. The possible falsification of one of these estimates is “hinted at” by the complete loss of correlation between them during the three years of the war.
3. We have revealed falsifications of Rosstat in calculating inflation in 2024. They were expressed in artificial underestimation of the specific weight of the most expensive goods and services, which allowed to reduce the weighted average and “adjust” the official inflation to a level below 10%.
4. The actual annual inflation in Russia for 2024, calculated with the correct application of the Rosstat methodology, amounted to at least 11.4%.
------------------------------------------------
Further on in the text these theses are disclosed in more detail.
------------------------------------------------
Alternative assessment
According to the ROMIR research holding company, annual inflation in Russia at the end of 2024 amounted to 22.1%, and on average for 2024 - 19.4% [ref], which is more than double the official data of Rosstat (see Fig. 1). What can explain such a big difference?
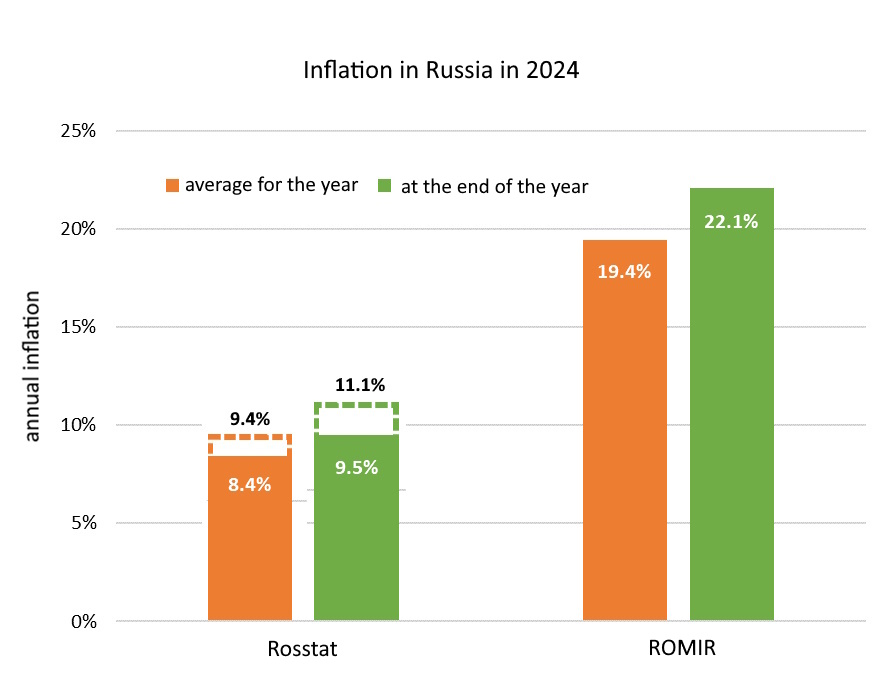
Fig. 1. Estimates of annual inflation in Russia in 2024: official according to Rosstat data
(based on the consumer price index), and alternative according to ROMIR (based on the FMCG deflator index).
The dotted line shows Rosstat's values for product inflation (i.e. excluding services and non-food products)
How inflation is calculated
Rosstat calculates inflation on the basis of the Consumer Price Index (CPI), while ROMIR calculates it on the basis of the FMCG Deflator Index. Both organizations follow a similar calculation sequence, which can be presented in four main steps:
Step 1: Selecting the composition of the consumer basket
Each organization uses its own composition of the consumer basket, i.e. a set of goods and services by which inflation is assessed. Each item in the basket (“product type”) combines goods or services with similar characteristics, for example, “rye flour bread”.
Step 2: Formation of the structure of the consumer basket
Each type of products from the basket is assigned a natural indicator of average statistical consumption, for example, per person per year (numbers are notional): 100 kg of potatoes, 56 kg of rye bread, 30 kg of fresh apples, 12 trips to the theater, 7 Gcal of heating, etc. Thus, each organization forms the structure of its consumer basket in natural terms.
Step 3: Collection and processing of the database on actual prices of goods and services
For each item of the consumer basket, Rosstat and ROMIR regularly (weekly or monthly) collect prices for relevant goods (services) from different regions across the country. These prices are averaged by regions and goods (services) within each item, thus determining the actual price of this item of the consumer basket in a given calendar period.
Step 4: Calculation of price indices and composite inflation rate
This stage is implemented differently by Rosstat and ROMIR:
Rosstat:
- at the end of the calendar year determines the weight share of costs for each item of the consumer basket, using actual prices for all items and the structure of the basket in natural terms; these weight shares of costs are assumed to be unchanged for the whole of the following year.
- calculates the relative change in the price of each individual type of product for a given reference period (week, month, from the beginning of the year). This relative change, expressed as a percentage, is called the Consumer Price Index (CPI).
- determines the composite CPI as a weighted average of the CPI for all types of products, taking into account their weighted shares of costs in the basket.
- calculates the value of inflation as the composite CPI minus 100%; in this case, the composite CPI for the last 12 months is used to calculate annual inflation.
ROMIR:
- at the end of each calendar month, determines the cost of the consumer basket based on the actual prices for all items and the basket structure in natural terms.
- determines the “FMCG deflator index” as the ratio of the value of the consumer basket in a given month to its value in January 2019 (base period), expressed as a percentage.
- calculates the value of inflation relative to January 2019 as the FMCG index-deflator minus 100%; to calculate annual inflation use the ratio of the FMCG index-deflator for a given month to the value of the FMCG index-deflator from 12 months ago.
Despite the fact that Rosstat and ROMIR apply formally different variants of Step 4 implementation, it can be shown that they are practically equivalent (but only if, according to the Rosstat methodology, the weighted shares of expenses for each item of the consumer basket are correctly adjusted annually, taking into account the CPI of this item in the previous year). Therefore, the main objective reasons for the more than twofold difference in inflation values (see Fig. 1) may lie in the peculiarities of implementation of steps 1, 2 and 3.
Analysis of peculiarities of inflation calculation methodologies
Composition of the consumer basket
ROMIR when estimating inflation considers only FMCG (Fast-Moving Consumer Goods), which includes food products and non-food products with a short period of use, such as cosmetics, personal care items, medicines, household chemicals, batteries, stationery, etc.
Rosstat calculates inflation for three groups of consumption items: food products, non-food products (both short- and long-term use, e.g. car, smartphone, TV, etc.) and services.
It is more correct to compare Rosstat's indicators with ROMIR indicators not for all three groups, but only for the group of food products. In such a comparison, in 2024 the difference between the official and alternative estimates is reduced, but still remains very large (see Fig. 1): at the end of 2024 - 11.1% for Rosstat vs. 22.1% for ROMIR, and on average for the year - respectively 9.4% vs. 19.4% [ref].
Structure of costs in the consumer basket
We do not know the cost structure in the ROMIR consumer basket, so we cannot directly compare it with the cost structure in the Rosstat basket. However, it can be demonstrated that differences in the adopted value of unit costs for the same goods can significantly affect the inflation assessment.
For example, let us consider the calculation of the weighted average CPI for a group of three goods A, B and C, for which the individual CPI values are 100%, 110% and 120%, respectively (see Table 1). If the unit costs between these goods are distributed in the proportion of 0.45 - 0.35 - 0.2, then the weighted average CPI is 108%. If the unit costs are distributed in the proportion of 0.2 - 0.35 - 0.45, then the weighted average CPI increases by 5% - to 113%.
Table 1. Impact of the weighted share of costs on average weighted inflation
(numbers are arbitrary)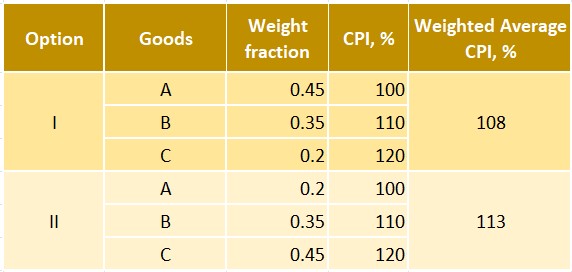
Price database
The Rosstat and ROMIR databases are comparable in their representativeness: 280 and 240 Russian cities, 550 and 200 types of products, 80 and 40 thousand sources of primary price data (for Rosstat, these are retail outlets, while for ROMIR, these are buyers).
The fundamental difference is that Rosstat uses the prices of goods and services offered for sale, regardless of whether they are bought or not (for this, the statistics service employees record prices at retail outlets weekly and at the end of each month), while ROMIR takes into account the prices of goods that were actually purchased, collecting scanned receipts of actual purchases from buyers.
This fundamental difference can significantly affect the amount of inflation. In particular, this is the main reason why official inflation according to Rosstat is always lower than the "observed" inflation monitored by the Central Bank of Russia [ref]. For example, as of December 2024, observed inflation over the past 12 months was 15.9% versus 9.5% according to Rosstat [ref].
----------------------
Thus, the significant difference in the inflation figures according to Rosstat and ROMIR data may be caused by methodological features:
- different sets of consumer baskets: Rosstat has goods and services, ROMIR has only fast-moving consumer goods;
- different weight shares of individual goods in total costs;
- different price sources: Rosstat tracks prices “on the shelves”, and ROMIR tracks real purchase receipts.
How significant can the difference in the annual inflation rate be due to these methodological features? Without complete source information from the Rosstat and ROMIR databases, it is impossible to answer this question accurately. According to our rough estimates, in extreme cases this difference can be around 10%, which corresponds to the difference observed in the Rosstat and ROMIR estimates for 2024 (see Fig. 1).
If the entire difference between the Rosstat and ROMIR estimates is really due to different calculation methods, then they should be considered as two different estimates of real inflation. As economists and commentators like to say, "everyone has their own inflation."
However, this does not exclude the possible influence of the data distortion factor, which leads to a deliberate underestimation or overestimation of real inflation calculated using this particular methodology.
Data Distortion
Identifying data manipulations concerning inflation is very challenging, at least for those not directly involved in the process of obtaining and processing the data. However, it is possible. The fact is that the results of calculating inflation using two independent methods, which objectively reflect real price changes, should correlate over a long period. In other words, the magnitude of the inflation estimates may differ, but over the long term, the overall trends in their dynamics should coincide.
We analyzed the correlation between Rosstat and ROMIR data over three periods:
• before February 2022 (i.e., before the start of the armed invasion and subsequent anti-Russian sanctions);
• from March 2022 to February 2023 (the first year of the war);
• from March 2023 to September 2024, when ROMIR, for reasons unknown to us, stopped publishing its FMCG deflator index data.
Выяснилось следующее (рис. 2 и 3): если в первом периоде данные Росстата и РОМИР очень тесно коррелировали между собой, то во втором периоде эта корреляция существенно уменьшилась, а в третьем – стала вообще статистически незначимой. В целях корректности на приведенных диаграммах использованы данные Росстата только по группе «продовольственные товары». Однако отмеченная закономерность повторяется и в том случае, если данные РОМИР сравнивать с общей инфляции по Росстату (соответствующие коэффициенты корреляции в указанные временные периоды равны 0,98 – 0,75 – 0,23).
The following was revealed (Figures 2 and 3): if, in the first period, the Rosstat and ROMIR data were very closely correlated, then in the second period, this correlation significantly decreased, and in the third period, it became statistically insignificant. For the sake of accuracy, the diagrams provided use Rosstat data only for the "food products" group. However, the noted pattern also repeats if ROMIR data is compared with overall inflation from Rosstat (the corresponding correlation coefficients for the indicated periods are 0.98 – 0.75 – 0.23).
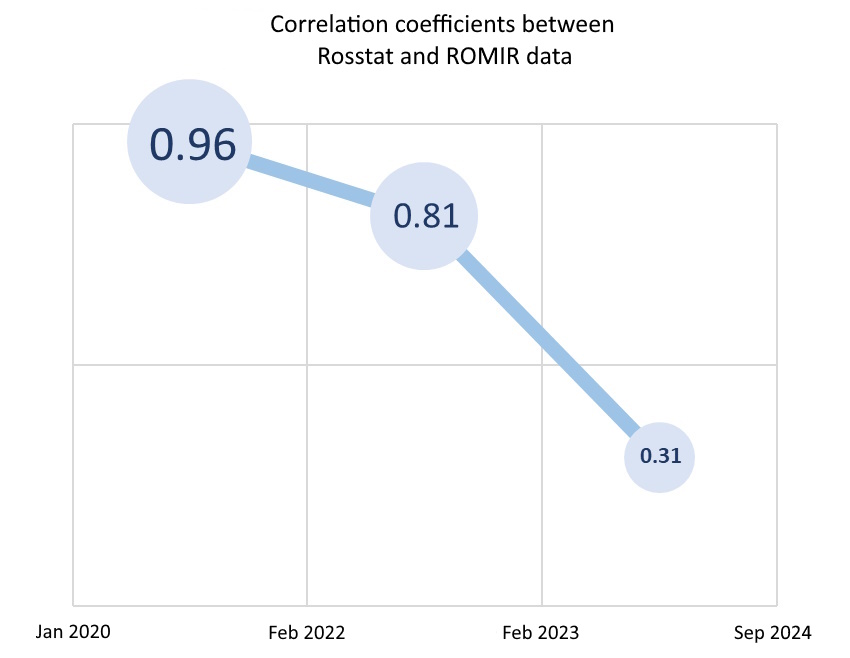
Fig. 2. Correlation coefficients between Rosstat data (food products) and ROMIR on annual inflation in different periods of time. It is clear that during the war the correlation between these data completely disappeared (for more details, see Fig. 3).
More detailed data are presented in the diagrams in Fig. 3, which show that before the start of the full-scale war (upper diagram), the correlation coefficient was 0.96, and the t-criterion of statistical significance significantly exceeded the critical 5% level for the given sample size. In the first year of the war (middle diagram), the correlation coefficient dropped to 0.81, but still remained statistically significant (the t-criterion was close to the critical 5% level). From the second year of the war (lower diagram), the correlation coefficient dropped to 0.31, indicating a virtual absence of correlation for the given sample size (the t-criterion is much lower than the critical 5% level)..jpg)
.jpg)
.jpg)
Fig. 3. Correlation field of annual inflation values according to Rosstat and ROMIR data.
The coordinates of each point correspond to the values of annual (i.e. for the previous 12 months) inflation according to Rosstat and ROMIR reports
in different months of the corresponding period of time.
The sharp decrease in the correlation coefficient between the inflation estimates by Rosstat and ROMIR for three years of the war may be due to data distortion by one of these organizations (or both at once). Of course, given the small sample size, this cannot serve as proof of such manipulations, but it does provide compelling grounds for purposefully looking for them.
Checking the correctness of the data
ROMIR does not publish its raw data on price changes for different types of goods in the consumer basket, so we were unable to independently verify the accuracy of their data and results. The only thing we can assert with confidence is that ROMIR has not changed the methodology for processing this data since January 2019, the base date relative to which they track their FMCG deflator index (see step 4 of the inflation calculation procedure described above).
Rosstat also does not disclose the prices for each of the 550 items of goods and services that are considered on a weekly and monthly basis. However, data for the portion of the consumer basket that is analyzed weekly (a little over 100 items out of 550) is published on the Rosstat website. This allowed us to independently replicate and analyze part of Rosstat's calculations. As a result, we identified a number of discrepancies. Here are the ones that directly affected the official inflation indicators in 2024:
1. Starting from the first week of December 2024, Rosstat stopped publishing the values of the consumer price index (CPI) for the item "Flight in the economy class cabin of an airplane", the cost of which by that time had increased by 30% since the beginning of the year. Accordingly, for the month of December and for 2024 as a whole, this item was not taken into account by Rosstat, which, naturally, underestimated the official inflation.
2. According to Rosstat's methodology, the weight of expenditures for each item in the consumer basket at the beginning of each calendar year should be adjusted in proportion to the CPI of the given basket item for the previous year. We independently recalculated these weights for all items for 2024 and compared the results with the values adopted by Rosstat for that year. The comparison results are presented in the diagram in Fig. 4. Each point on this diagram corresponds to a specific item in the consumer basket. If Rosstat had not made any changes to the established calculation procedure, all points should have aligned in a diagonal straight line inclined at a 45° angle to the coordinate axes. However, it is evident that several points deviate abnormally from this line. Let's examine some of the points (basket items) in more detail:
Point 1 — Fresh cucumbers. In 2023, their prices increased by 35% (i.e. CPI = 135%). This should have led to an increase in their share in total expenditure on the consumer basket from 0.548% in 2023 to 0.675% in 2024. However, Rosstat increased their share in 2024 only to 0.577%.
Point 2 — Fresh tomatoes. Their prices increased by 64% in 2023 (i.e. CPI = 164%). This should have led to an increase in their share in total costs from 0.473% in 2023 to 0.710% in 2024. However, Rosstat increased their weight share in 2024 only to 0.570%.
Point 4 — Smartphone. With its weight share in 2023 equal to 0.676% and a price increase of only 1% in 2023, its weight share in 2024 should have decreased to 0.623% (since the average weighted inflation for other items turned out to be significantly higher than 1%). Rosstat, on the contrary, increased the weight share for the smartphone to 0.726% for 2024.
Point 8 — Flight in the economy class cabin of an airplane. The price for 2023 increased by 58%. Accordingly, its weight share should have increased from 0.484 in 2023 to 0.700 in 2024. However, Rosstat left its weight share for 2024 at the same level, i.e. 0.484.
.jpg)
Fig. 4. Ratio of cost weights for 2024: horizontally - values obtained with the correct application of the Rosstat methodology, taking into account the weights and CPI of the corresponding items of the consumer basket in 2023; vertically - values adopted by Rosstat.
Detailed data for all eight abnormal points highlighted in Fig. 4 are provided in Table 2. The general pattern is as follows: for the items that increased in price most in 2023, Rosstat underestimated the weight shares in total costs for 2024, and vice versa, for the item for which the price in 2023 remained virtually unchanged (point 4 — smartphone), Rosstat sharply overestimated the weight share for 2024. All this led to an artificial underestimation of the weighted average inflation in 2024.
In order to determine the quantitative effect of these manipulations, we repeated the calculation according to the Rosstat methodology using corrected initial data (weight shares — according to the fifth column in Table 2 and a 30% increase in the price for the item “Flight in the economy class cabin of an airplane” in 2024). As a result, we obtained the following result (Fig. 5):
- annual inflation for the whole of 2024 – 11.4%;
- the average annual inflation for all months of 2024 is 10.3%.
Table 2. Distortions in the specific weights of costs allowed by Rosstat for 2024 for individual items of the consumer basket
%20Eng.jpg)
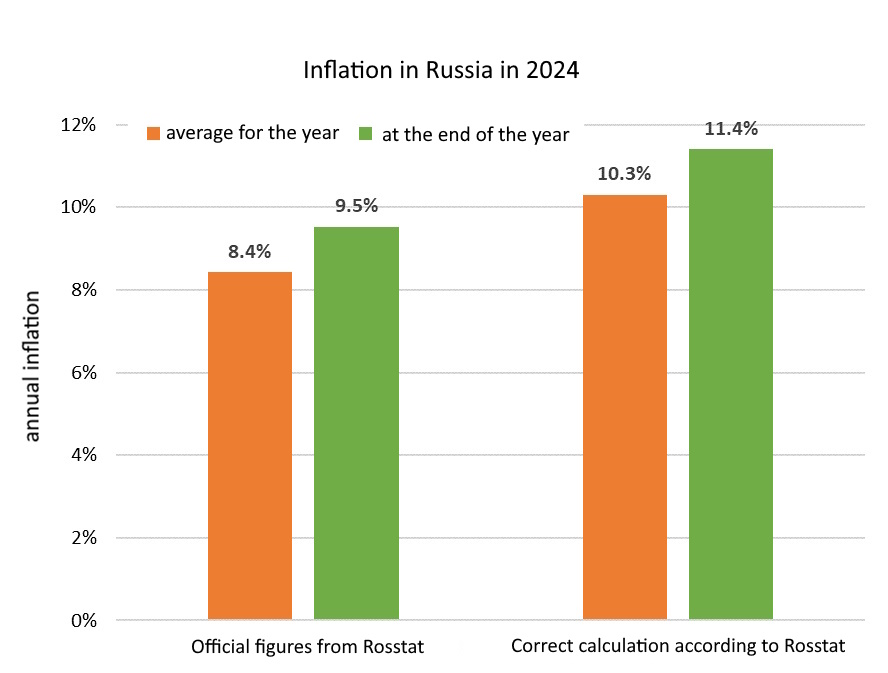
Fig. 5. Annual inflation in Russia in 2024: official according to Rosstat data and calculated (lower estimate) according to their database, but without distortions in the calculation methodology
Final comments
1) Our research is not related to "real" inflation and economists' disputes about how to calculate it. We are talking about something else: Rosstat is "disingenuous" when calculating consolidated inflation indicators, understating their value.
2) We have identified the fact that Rosstat understates its indicators by approximately 2% in the openly published part of the data (slightly more than 100 items). This gives reason to doubt the correctness of other data closed by Rosstat (the remaining 450 items). Therefore, the value of annual inflation in Russia in December 2024 that we obtained (11.4%) should be considered as a lower estimate. This means that the actual annual inflation, correctly calculated using the Rosstat methodology, in 2024 was no less than 11.4%.
Verdict
.jpg)
Official data that annual inflation in Russia in 2024 did not exceed 10% is a manipulation. Rosstat artificially underestimated the share of the most expensive goods and services in the consumer basket, which made it possible to reduce the weighted average inflation rate and adjust it to the desired value. In fact, with the correct application of Rosstat's methodology, annual inflation in December 2024 was at least 11.4%, which indicates that Russia has entered the stage of galloping inflation.
Cover image: Zimbabwe's one hundred trillion dollar banknote. Source: Wikimedia Commons

.png) Dear reader, We invite you to share your opinion about this article and the Trust but Verify project in general through available communication channels. We will take your opinion into account when selecting content and verifying information. If your arguments are convincing, we are ready to make adjustments in evaluating statements, facts and conclusions.
Dear reader, We invite you to share your opinion about this article and the Trust but Verify project in general through available communication channels. We will take your opinion into account when selecting content and verifying information. If your arguments are convincing, we are ready to make adjustments in evaluating statements, facts and conclusions.